Ericsson leverages Eclipse Theia to deliver user friendly cloud-first development and debugging capabilities
This is a guest post by Ericsson, an Eclipse Cloud DevTools Strategic Working Group member. Authored by Colin Grant and Kenneth Marut, Web Technology Developers at Ericsson.
When dealing with low-level code, the ability to inspect the state of memory as a program unfolds is a critical tool in a developer’s toolbox. To make that process as accessible as possible, we’ve been working at Ericsson to improve the capabilities of the Theia CPP Extension's cpp-debug-extension, and we are excited to make that work available to the open source community. This work, which we’re calling the improved ‘Memory Inspector,’ includes significant improvements to the frontend of the extension as well as a number of new features to improve the experience of viewing memory during a debug session. Developers building custom IDEs for low-level development with Eclipse Theia are welcome to try out the Memory Inspector and include it in their own products.
Cloud-based IDEs have become increasingly popular due to their operating system agnosticism, ease of setup, and flexibility. The Theia CPP Extension is built for Eclipse Theia, an open source, extensible IDE framework built with web technologies that allows users to develop custom cloud and desktop IDEs. A Theia-based IDE can run in either a desktop (using Electron) or browser environment and is ideal for creating a custom IDE tailored to a specific use case. Our work at Ericsson leverages Theia's flexibility by allowing us to deploy a desktop application to meet current needs while planning for a cloud-first future of work primarily in the browser. We have been building the next-generation IDE for our C developers, providing them with a modern user-interface, convenient wrappers around custom tooling, and an overall updated workflow so they can be more productive and effective in a world where remote work and distributed teams are increasingly common.
One important area of focus for us is improving the debugging experience. Our users had been dissatisfied with the cpp-debug extension’s existing memory viewer, naturally comparing it to the legacy memory viewer available in the Eclipse IDE. As we received more user feedback regarding the memory viewer, and after several weeks of design and implementation, we released the Memory Inspector internally, designed with Theia's goals of extensibility and adherence to open-source standards in mind.
By default, the Memory Inspector depends on the requests built into the Debug Adapter Protocol and is compatible with any debug adapter that implements a ReadMemory request, but it allows adopters to substitute any memory providing mechanism desired. It is built with several use cases already in mind, including displaying memory, viewing registers, and comparing memory from different regions or different points in time; it also includes a UI for writing memory values, for debug adapters that support a custom WriteMemory request ahead of that request's addition to the Debug Adapter specification. Adopters can easily extend these classes and customize the behavior to suit their use cases and the specific capabilities of their chosen debug adapter.
The list below highlights some of the primary improvements provided by the Memory Inspector:
More entry points for viewing memory during a debug session
Create a new memory view during a debug session by right-clicking inside the debugger pane’s Variable tree view.
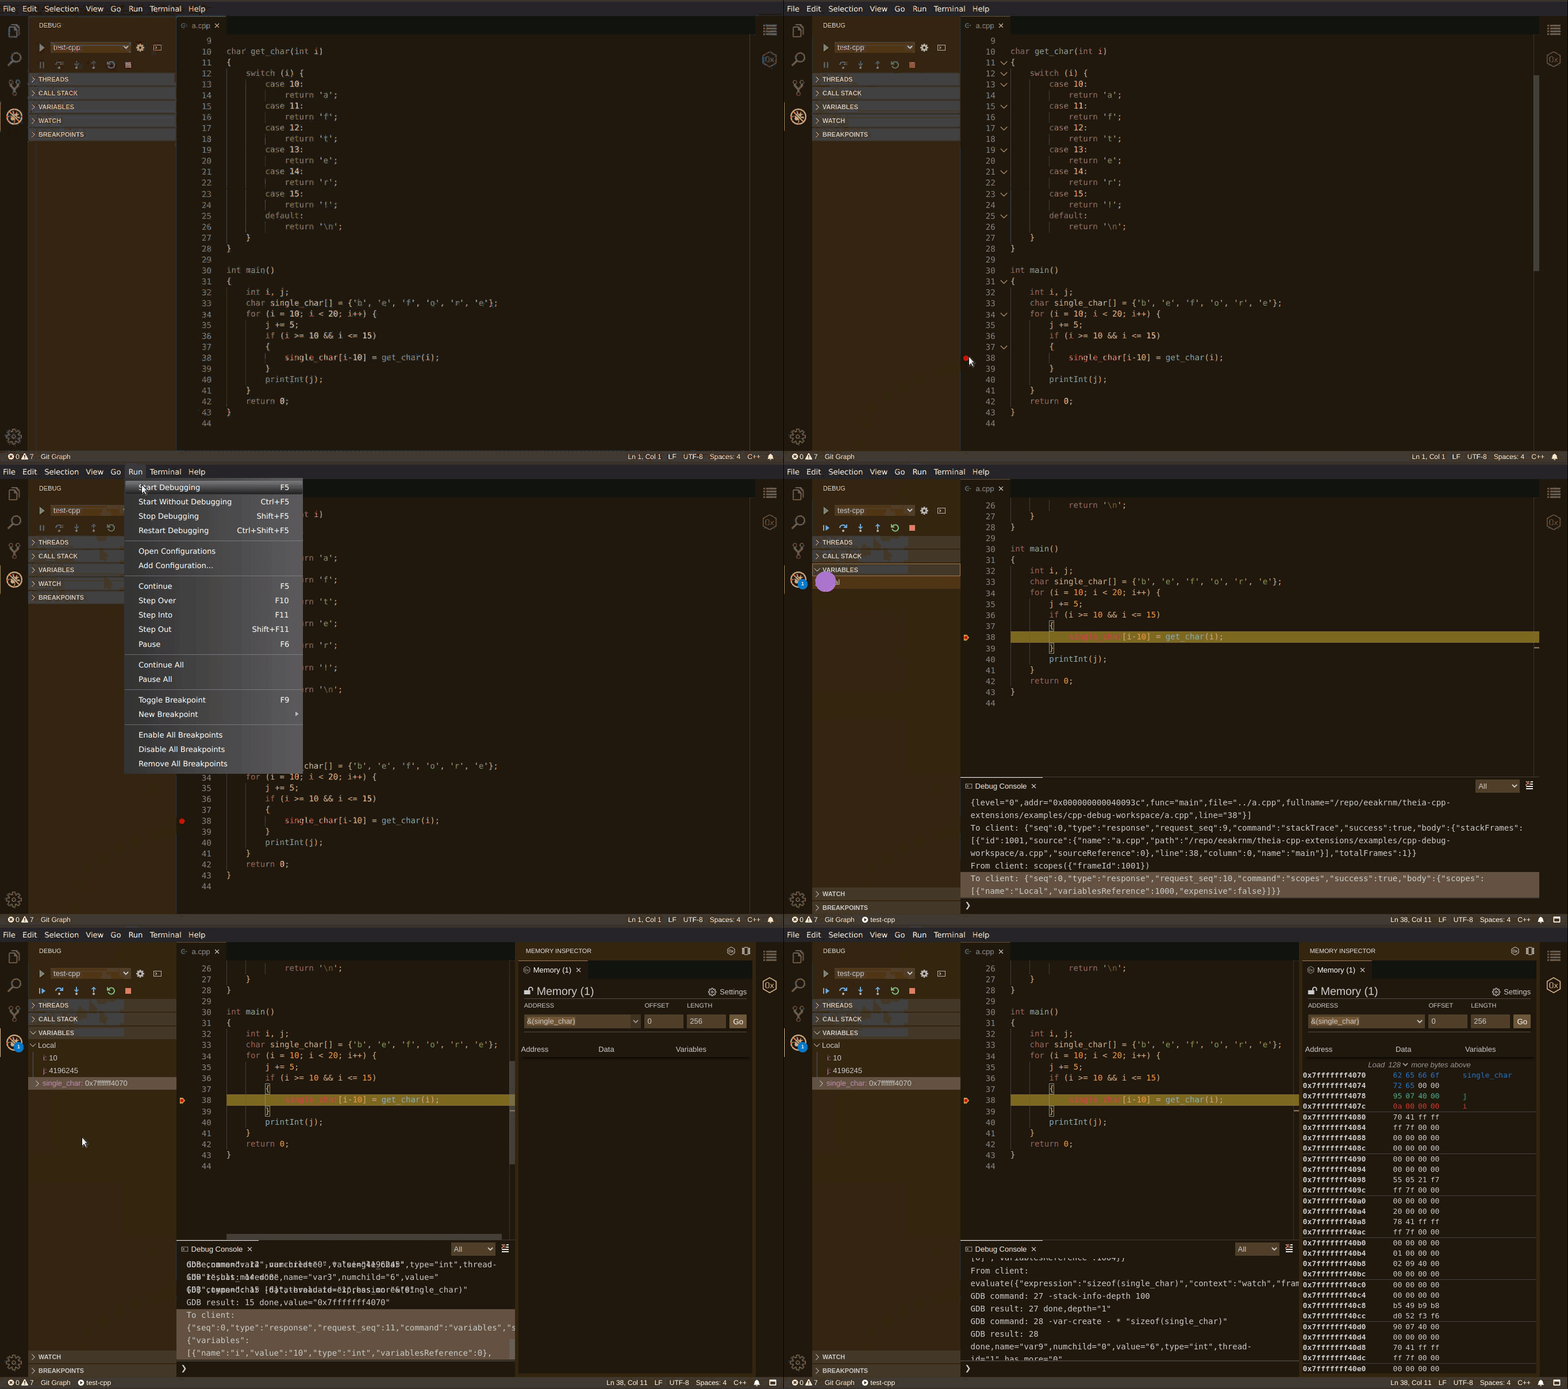
Click here for full size image.
Alternatively, generate a new memory by clicking on the Create New Memory View icon in the toolbar, and manually specify an address.
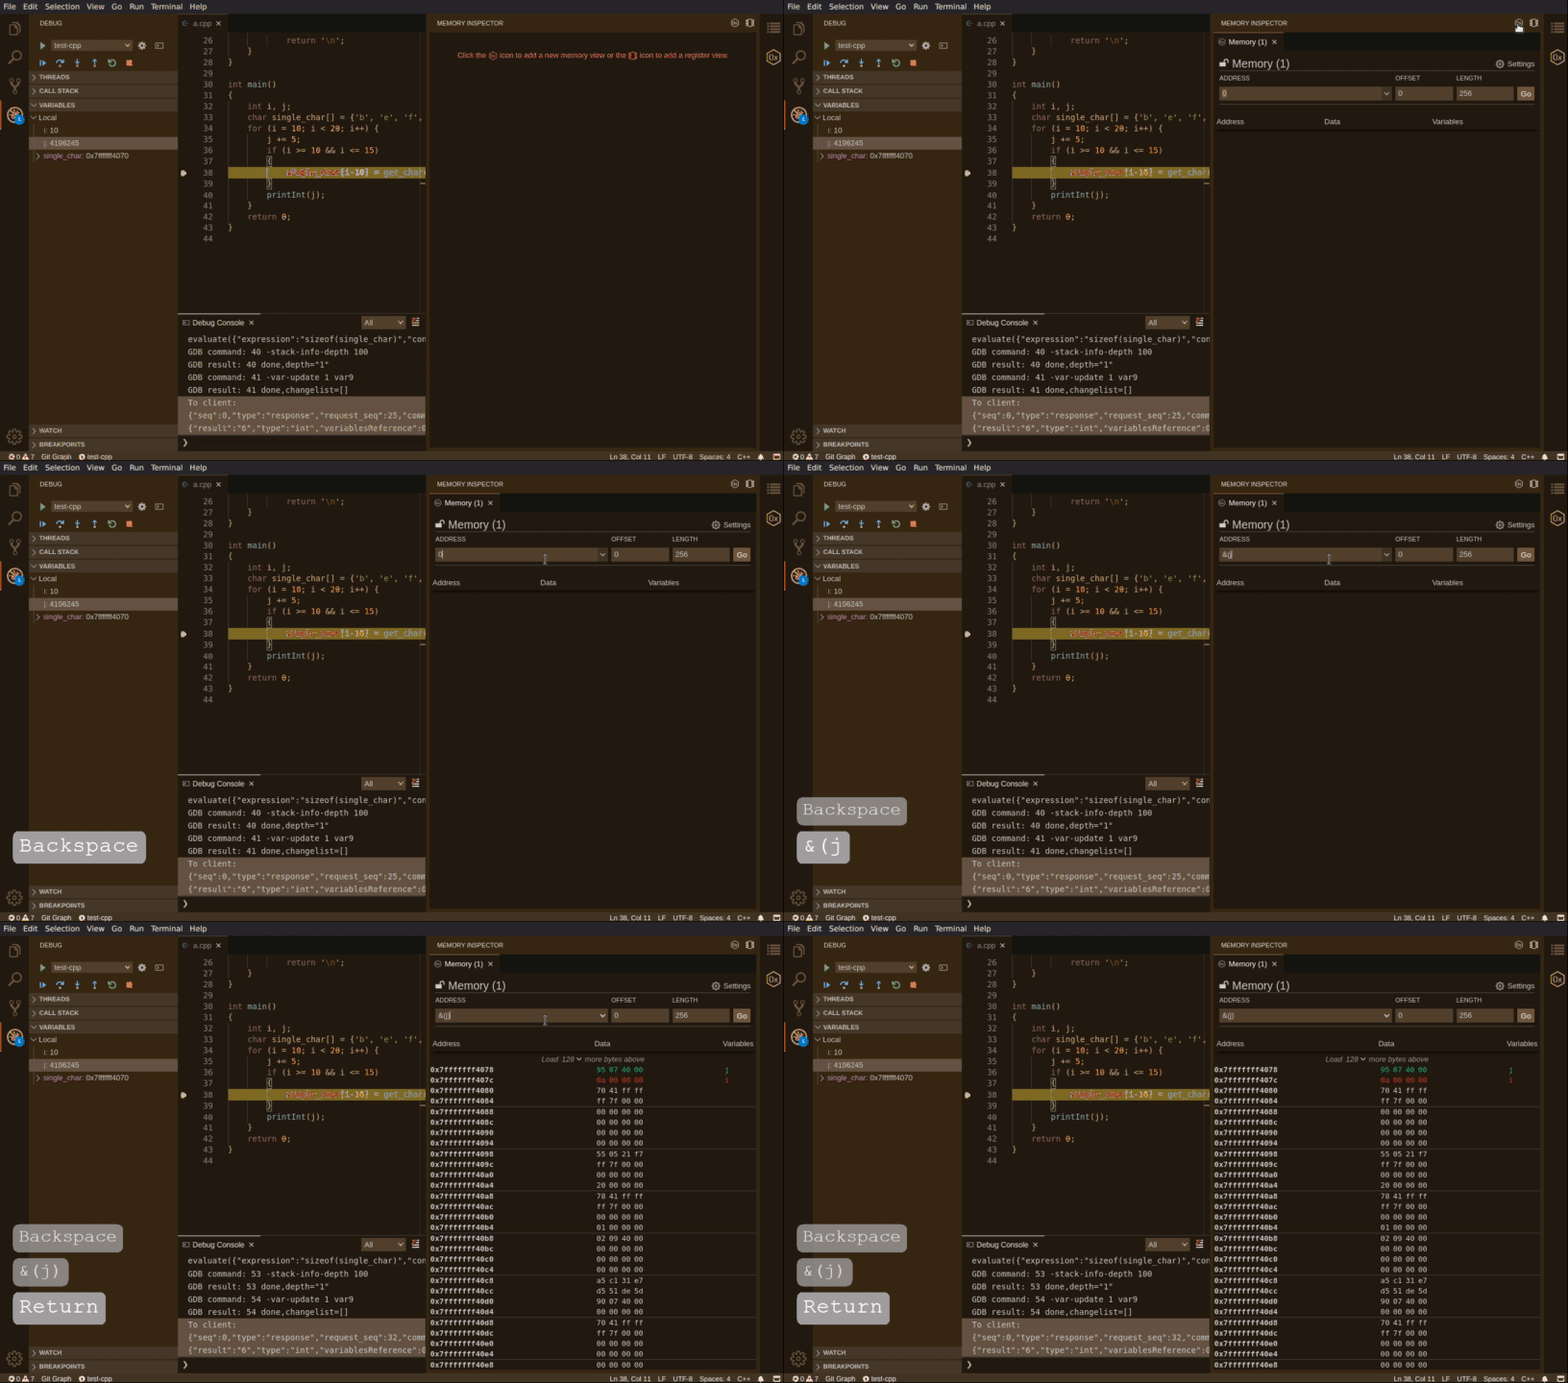
Click here for full size image.
Dynamic updating views while advancing the debugger
Memory views are now dynamic and will update as you step through code. Memory locations that have changed from one frame to the next will be highlighted.
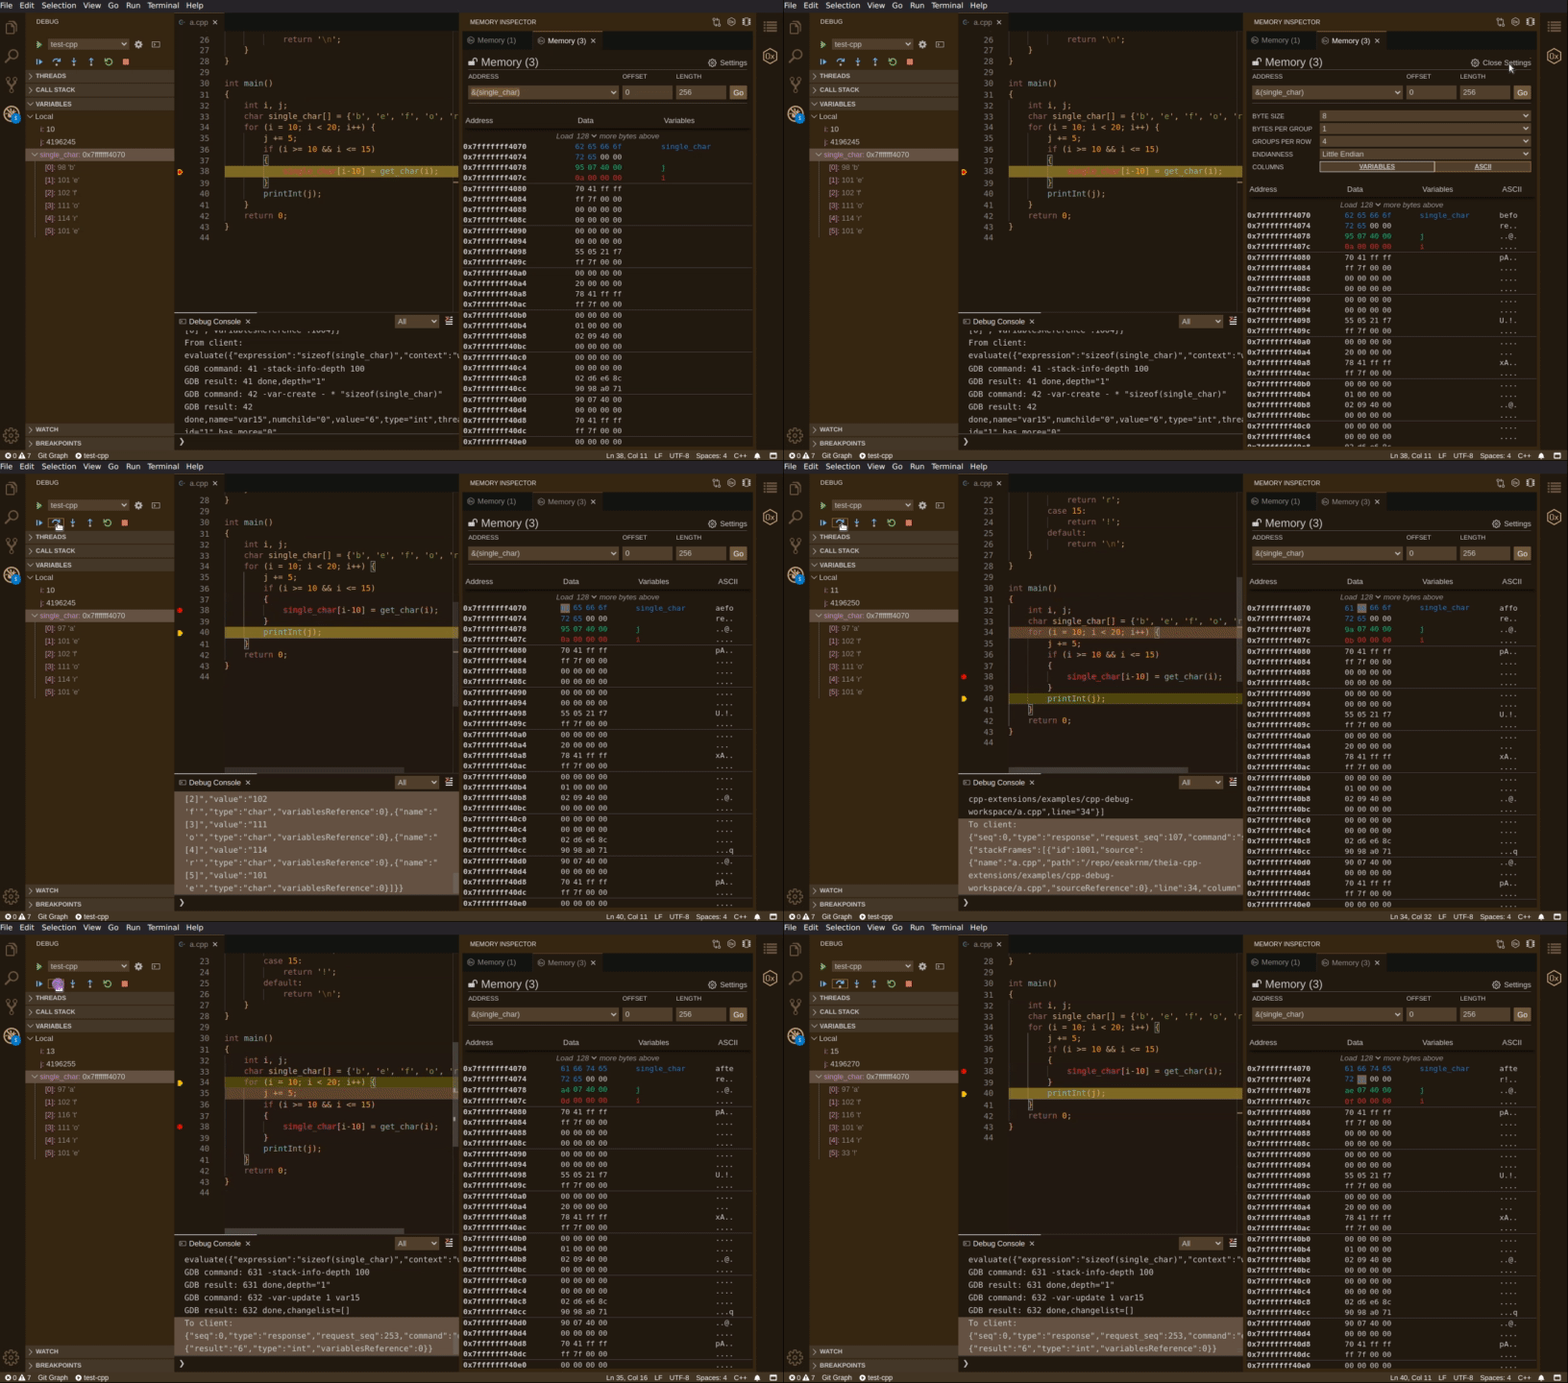
Click here for full size image.
Improved settings and configuration
Memory views now have editable titles for better organization. Additionally, each view will populate a list of recently viewed addresses for easily swapping between locations. Views also can now be ‘locked’ in time, preventing dynamic updates (this may be useful for comparing a single memory address at separate times).
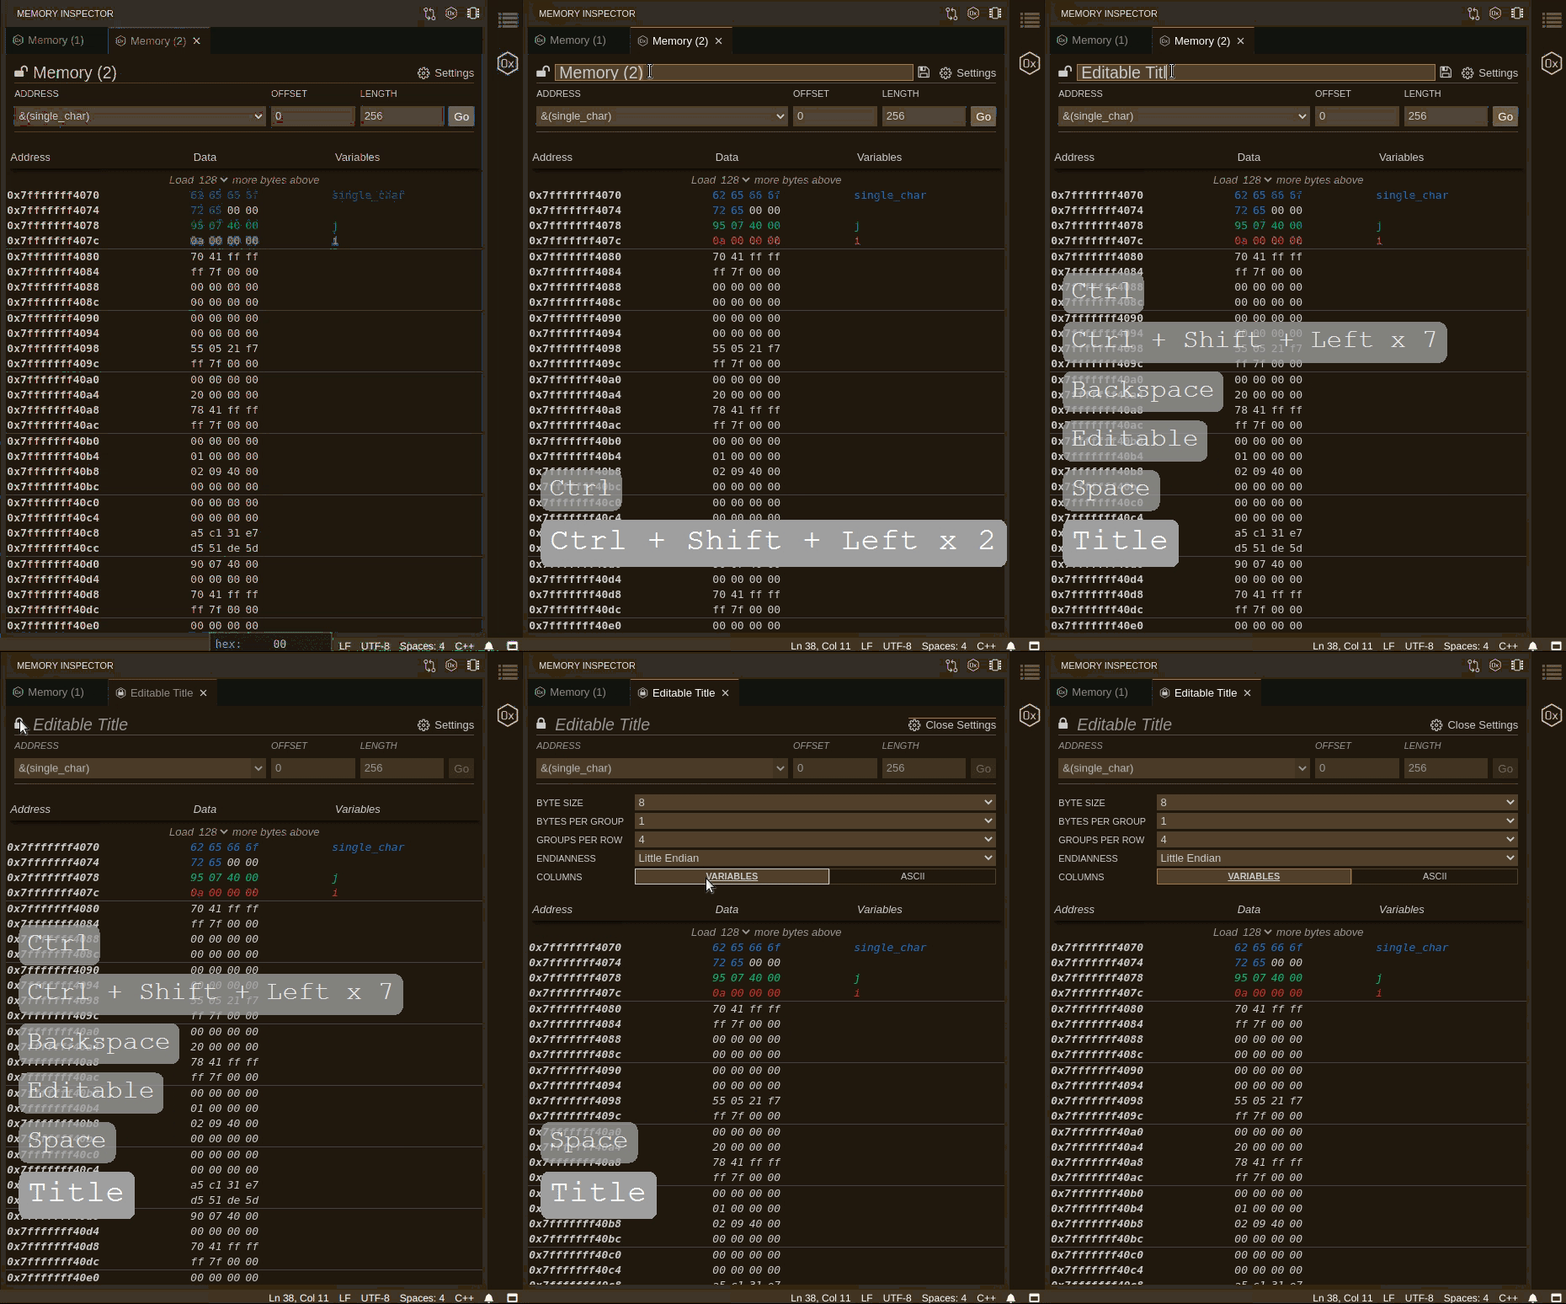
Click here for full size image.
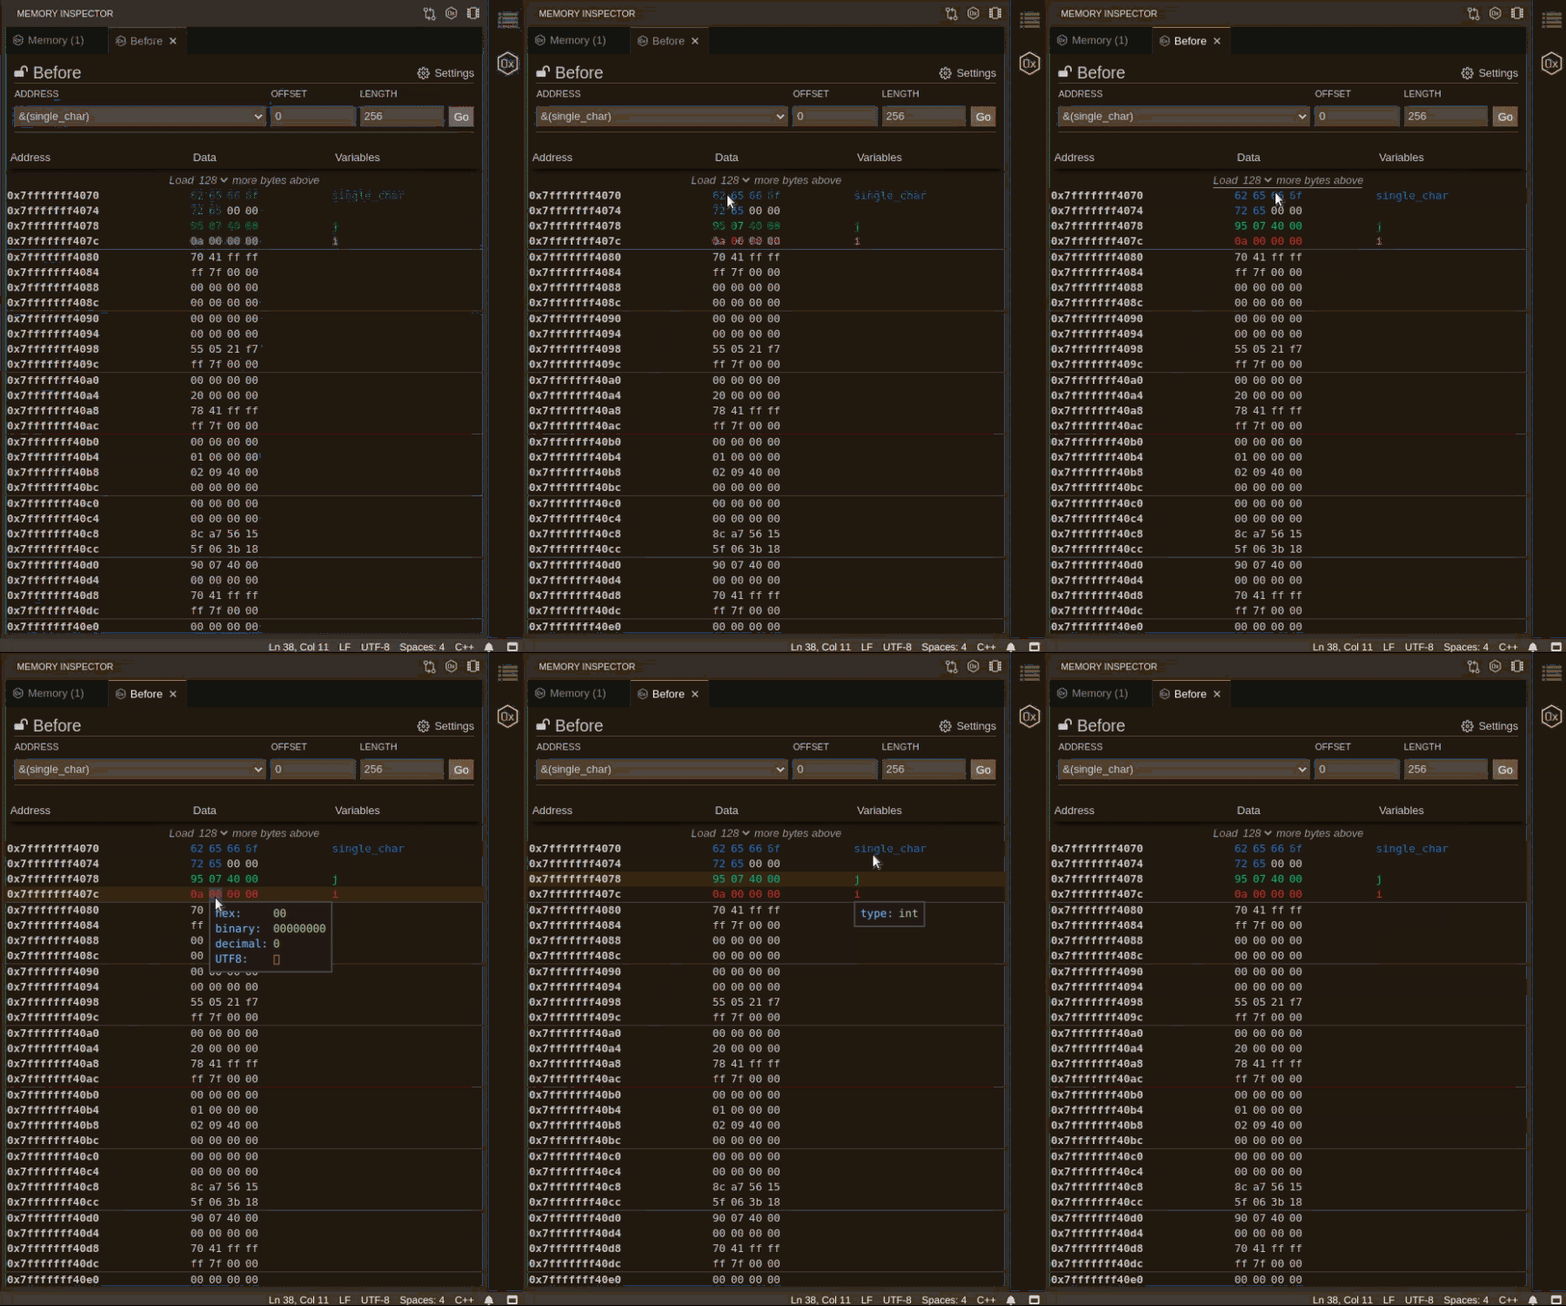
Inspect memory values on-hover
Improving on Simon Marchi’s work in this pull request, we have added and improved the ability to show colorized variable values in-line with memory addresses (high contrast theme also added). A custom hover renderer displays different representations (radices) when hovering over values.
Click here for full size image.
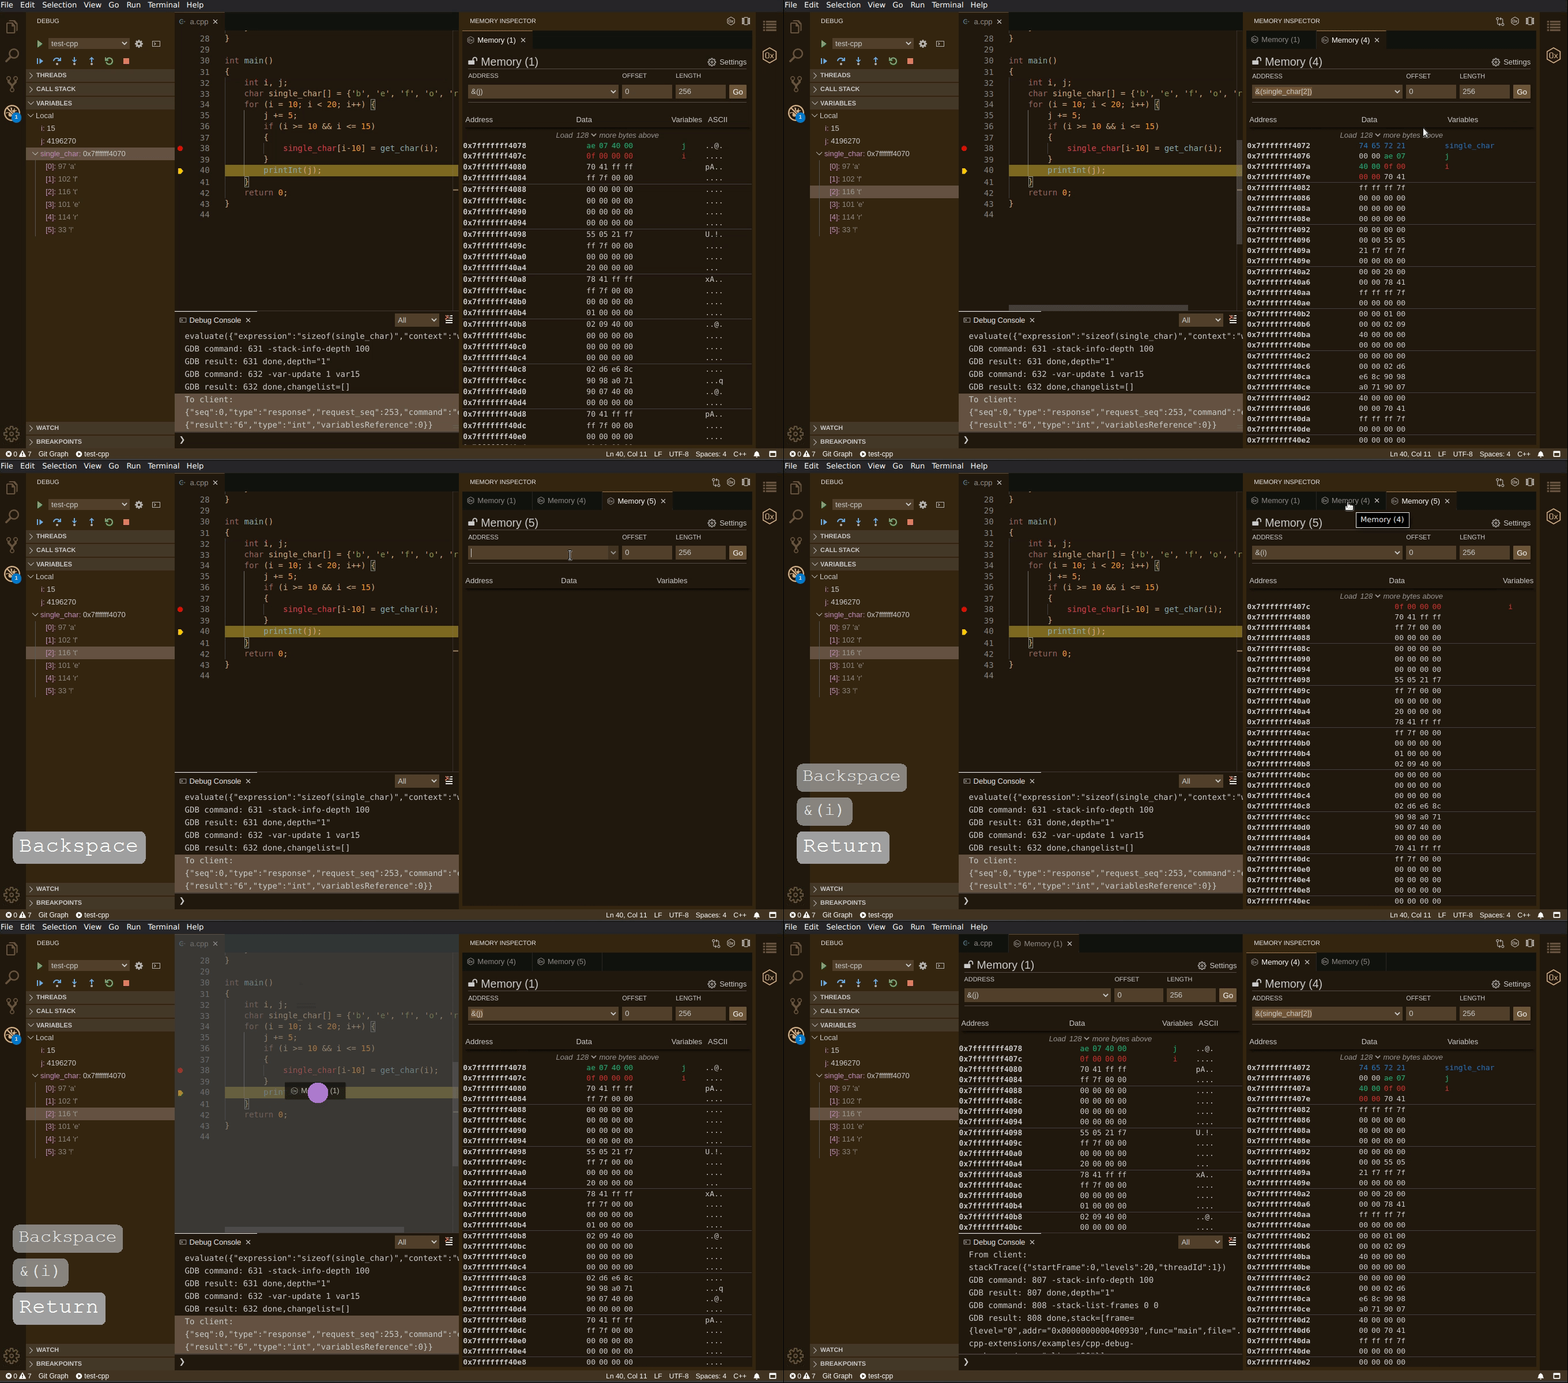
Support of multiple memory views
Spawn any number of memory views, independent of each other and drag/drop them to anywhere inside of the application window.
Click here for full size image.
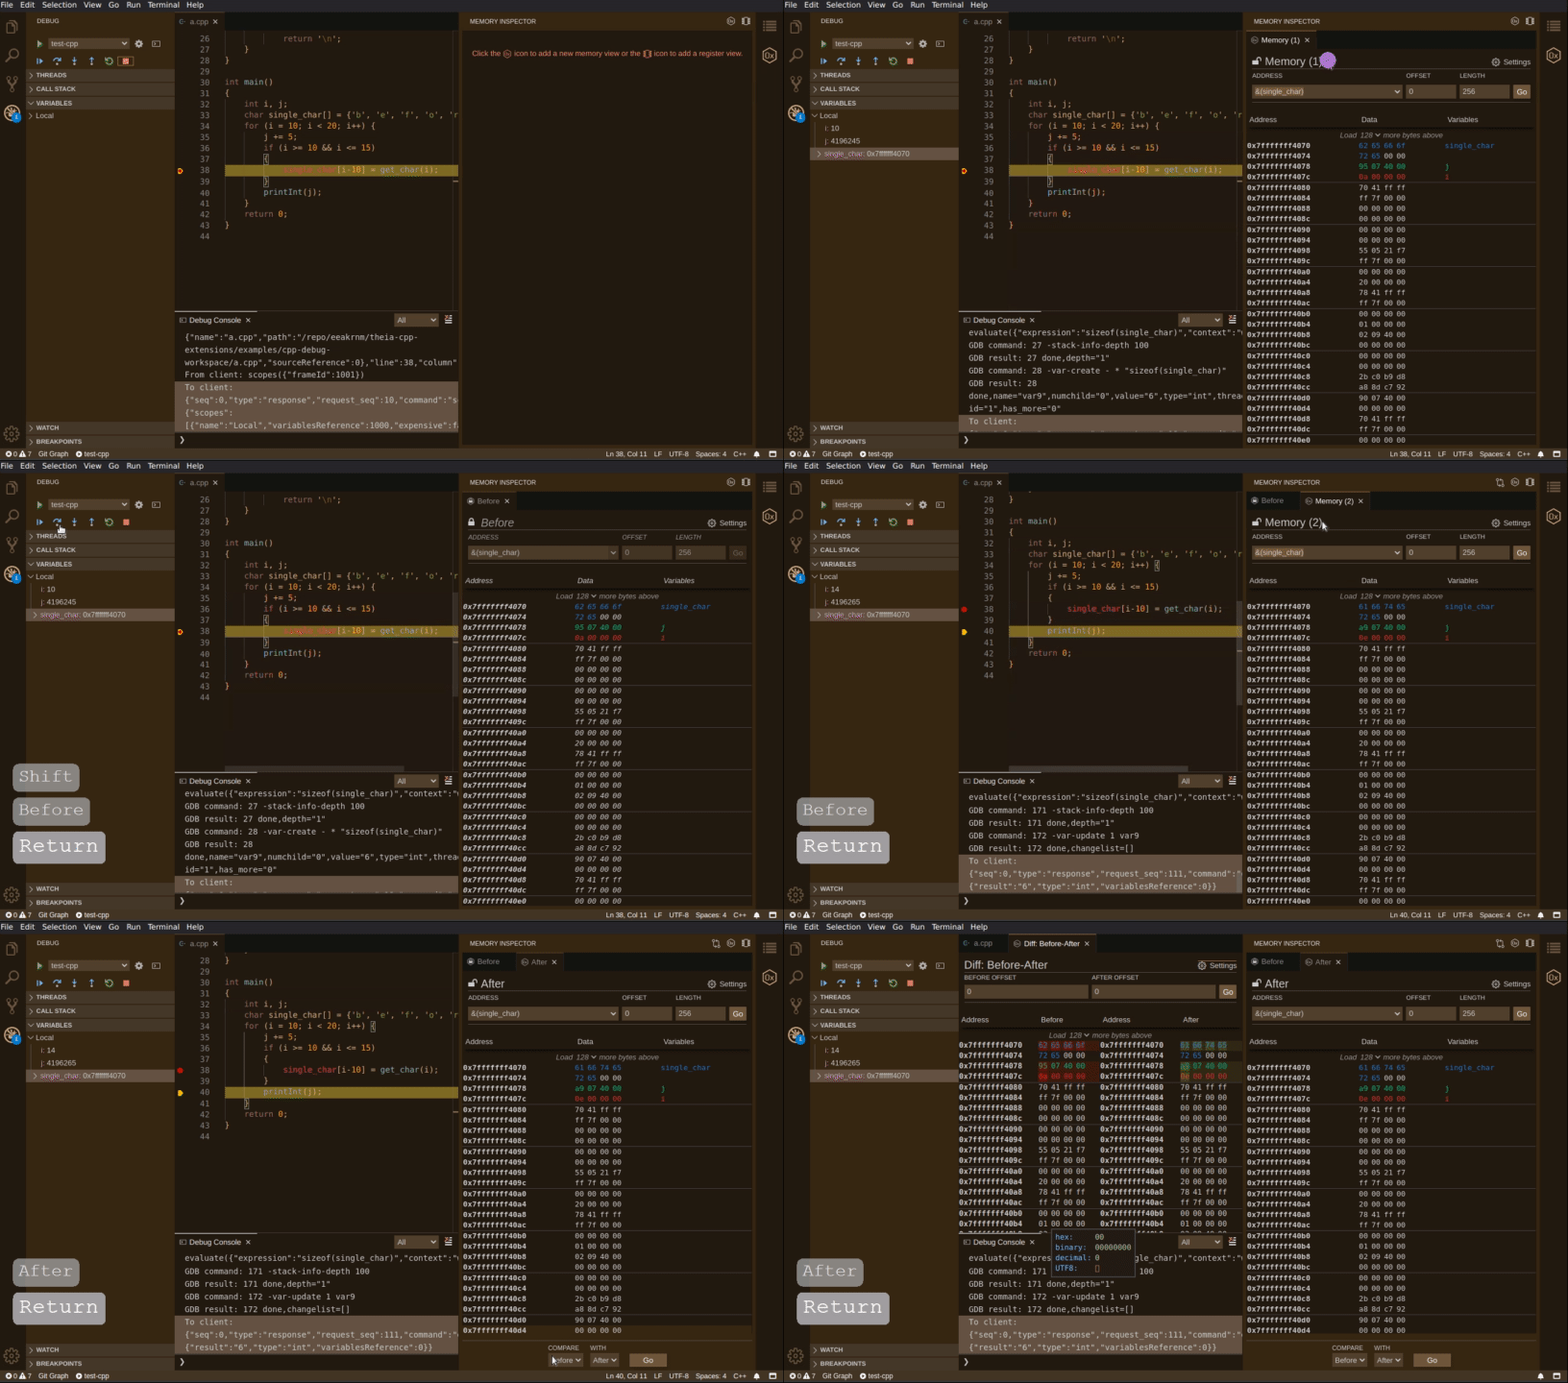
Memory views can now be ‘diffed’, allowing you to compare memory at different addresses and/or different times.
Click here for full size image.
We are excited to make the Memory Inspector available to the Eclipse Theia community, and hope that it will benefit others building IDEs for low-level development. With the future in mind, debugging memory using Theia may soon have an edge over other IDEs by encouraging and enabling collaborative memory debugging and workspace sharing. The pull request for the Memory Inspector can be found here with step-by-step setup instructions. We encourage anyone who may be interested to try it out and submit any comments, questions, or feedback via GitHub.
