As a general rule, I don’t like to have too much Java code in Java ServerPages (JSP) files. In fact, I’d prefer to have no Java code at all in a JSP. I have two basic reasons (and a collection of less basic reasons)… First, Java code in a JSP tends to be used to provide business logic; business logic doesn’t belong in the view layer and should instead by tucked somewhere behind a servlet. Second, JSPs are intended to be modified by content editors who–despite being wizards with HTML, JavaScript, AJAX, and whatnot–are blissfully unknowledgeable about Java (you don’t want these people to have the opportunity to change your Java code). That discussion aside, let’s just say that you have a very good reason to have a bunch of Java code in your JSP…
Before you can debug JSPs, you need to install the Eclipse WebTools. You can do this through the Callisto Update Site (click here to what a demonstration), or you can just download an all-in-one (Eclipse + everything you need for web development) here.
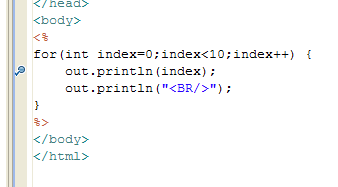
With WebTools installed, you can add one or more breakpoints by opening an editor on the JSP file, and double-clicking in the left-hand column. A breakpoint icon will appear as shown below.
Now, you need only start the server in debug mode. You can do this by right-clicking in the JSP editor or on the JSP file in the package explorer and selecting “Debug As > Debug on Server”, or by clicking the “Start in Debug Mode” icon (little picture of a bug) on the “Servers” view (shown below).

When execution reaches the breakpoint, Eclipse will drop you into the Debug perspective where you can hop, skip, jump, and inspect variables to your heart’s content.